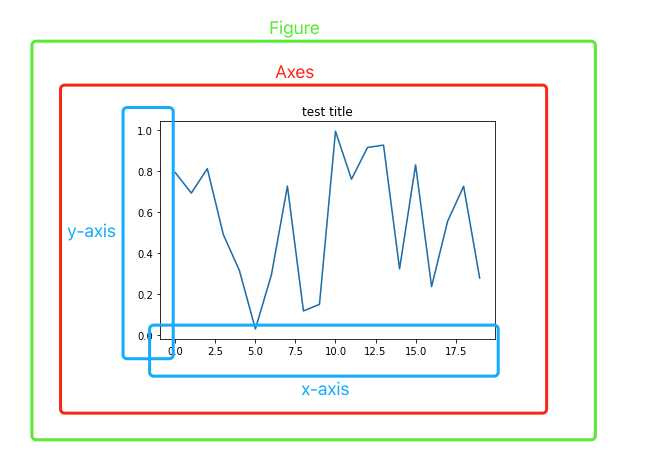
matplotlib
In [3]:
Copied!
import numpy as np
import matplotlib.pyplot as plt
import numpy as np
import matplotlib.pyplot as plt
In [10]:
Copied!
x = np.arange(-10, 11, .25)
x
x = np.arange(-10, 11, .25)
x
Out[10]:
array([-10.  ,  -9.75,  -9.5 ,  -9.25,  -9.  ,  -8.75,  -8.5 ,  -8.25,
        -8.  ,  -7.75,  -7.5 ,  -7.25,  -7.  ,  -6.75,  -6.5 ,  -6.25,
        -6.  ,  -5.75,  -5.5 ,  -5.25,  -5.  ,  -4.75,  -4.5 ,  -4.25,
        -4.  ,  -3.75,  -3.5 ,  -3.25,  -3.  ,  -2.75,  -2.5 ,  -2.25,
        -2.  ,  -1.75,  -1.5 ,  -1.25,  -1.  ,  -0.75,  -0.5 ,  -0.25,
         0.  ,   0.25,   0.5 ,   0.75,   1.  ,   1.25,   1.5 ,   1.75,
         2.  ,   2.25,   2.5 ,   2.75,   3.  ,   3.25,   3.5 ,   3.75,
         4.  ,   4.25,   4.5 ,   4.75,   5.  ,   5.25,   5.5 ,   5.75,
         6.  ,   6.25,   6.5 ,   6.75,   7.  ,   7.25,   7.5 ,   7.75,
         8.  ,   8.25,   8.5 ,   8.75,   9.  ,   9.25,   9.5 ,   9.75,
        10.  ,  10.25,  10.5 ,  10.75])
In [11]:
Copied!
plt.plot(np.sin(x))
plt.plot(np.sin(x))
Out[11]:
[<matplotlib.lines.Line2D at 0x2adebf74a90>]

In [20]:
Copied!
fig = plt.figure(figsize = (10,10))

plt.plot(np.sin(x))
fig = plt.figure(figsize = (10,10))
plt.plot(np.sin(x))
Out[20]:
[<matplotlib.lines.Line2D at 0x2adec056cd0>]
In [13]:
Copied!
fig, ax = plt.subplots(2, 2, figsize=(10,10))

ax[0,0].plot(np.sin(x), c='seagreen', linewidth=5)
ax[0,1].plot(np.cos(x), c='orange', linewidth=5)
ax[1,0].plot(np.log(x), c='teal', linewidth=5)
ax[1,1].plot(np.exp(x), c='firebrick', linewidth=5)

plt.show()
fig, ax = plt.subplots(2, 2, figsize=(10,10))
ax[0,0].plot(np.sin(x), c='seagreen', linewidth=5)
ax[0,1].plot(np.cos(x), c='orange', linewidth=5)
ax[1,0].plot(np.log(x), c='teal', linewidth=5)
ax[1,1].plot(np.exp(x), c='firebrick', linewidth=5)
plt.show()
C:\Users\ferra\AppData\Local\Temp/ipykernel_6920/3511292507.py:8: RuntimeWarning: divide by zero encountered in log
  ax[1,0].plot(np.log(x), c='teal', linewidth=5)
C:\Users\ferra\AppData\Local\Temp/ipykernel_6920/3511292507.py:8: RuntimeWarning: invalid value encountered in log
  ax[1,0].plot(np.log(x), c='teal', linewidth=5)